The advanced sales dashboard for the grower
At a glance, data about your sales of plants and flowers. Grow as a company with the help of useful analyses.

At a glance, data about your sales of plants and flowers. Grow as a company with the help of useful analyses.


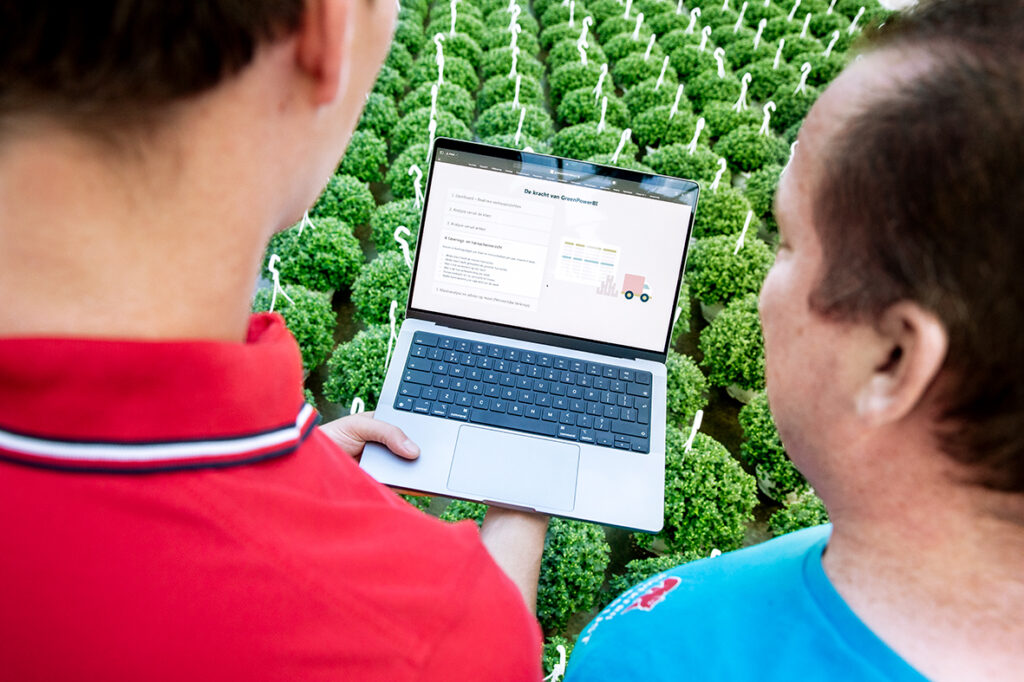
GreenPowerBI is a sales dashboard specially designed for flower and plant growers. The dashboard provides a clear overview of turnover and sales data. As a grower you immediately see where sales optimization is possible. Whether it concerns results that can be achieved quickly ('low hanging fruit') or strategic long-term decisions, GreenPowerBI gives you the important insights.
Over OnsThe source of GreenPowerBI is your own transactions from Floriday. After you, as a grower, have given permission, your transactions are read every night in your own GreenPowerBI environment. Personalized dashboards are then compiled from GreenPowerBI that provide detailed insights into your turnover and sales data.
Over functionaliteiten
 Turnover Direct Sales/Clock per week and cumulative
 Percentage of Direct Sales/Clock per week and cumulative
 Number of Direct Sales and Clock customers per week and cumulatively
 Number of Plants sold per week and average price
  Which customer is increasing and which is decreasing compared to last year
 Which items are ordered
 Which items are they not yet purchasing? Through article advice, the customer receives “low hanging fruit” on a silver platter
 What is the customer's ordering pattern?
 Easily monitor Strategic Orders
  What is the average price of Direct Sales versus Clock
 Is the article ahead or behind last year's numbers?
 Is the item ahead or behind in terms of average price last year
 What is the turnover of a total article group
 Numbers and turnover specified by sorting
 Advice on seasonal products
  Which customer has the most transactions
 Which customer has the largest transactions on average
 What is the return on a customer
 What is the transaction spread per week
 Transaction details down to delivery note level
 Which customer often orders at the end of the week
  Market analyses
 Recommendations for sales strategies


Starten is simpel, met een druk op de knop nemen we contact met je op voor een demo. Geïnteresseerd? Geef je e-mail op!